In this practicum, I will focus on analyzing data that shows the distribution of race and ethnicity among the deceased that law enforcement agencies killed in 2015 & 2016. In order to do this analysis, I will first begin by visualizing the data provided. After downloading and formatting the data collected for 2015 and 2016, I run them through Cytoscape. Cytoscape is a program that turns the data inputted into visual networks and data trees.
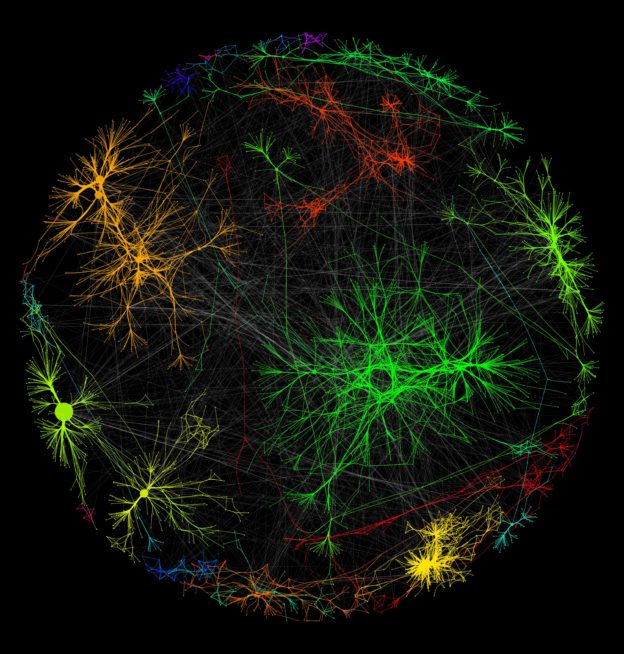
Visual From 2015 Data:

Visual From 2016 Data:

All of these tree structures surround inner nodes that represent different races. From looking at the tree structures, it seems that for both years, whites have been the main victims of deadly encounters with law enforcement. The other races have large numbers as well, but visually I see most of the edges branching off of the “white” node. The inner node with the second most branches would be the “black” node. This correlation is representative in both 2015 & 2016.
Visually, I have formed two conclusions. Whites have been the main victims of deadly encounters with law enforcement and second to that would be those who are black. Why is this? Before this visualization, I was under the impression that minority races were most likely to be killed by law enforcement. This perception probably developed due to the influx of media outlets that have circulated countless videos of minority races being oppressed and abused by law enforcement.
In an effort to bridge the gap between the data tree visualizations and find an explanation behind the story they tell, I began to search the web. According to sources on the FederalistPapers.org, and Politifact.com, blacks only make up 12% of the population while whites make up about 63%. This accounts for the reason behind why more whites are killed by police than black, but behind this statistic reveals inequality and injustice within society.
Although fewer blacks are killed by law enforcement than whites, it turns out that blacks are 2.5 times more likely to be killed. Critics often state that black Americans are more likely to commit crimes, and that is why they are more likely to be killed, but this statement is false. The Bureau of Justice Statistics reported that in 2004, state courts had over 1 million felony convictions. Of those, 59 percent were committed by whites and 38 percent by blacks.
Now although blacks commit far fewer crimes, the felony rates stand at 330 per 100,000 for whites and 1,178 per 100,000 for blacks. It is clear that in today’s society, race is still an issue within society. From analyzing the bits of data shown in the data trees and from my deep dive into finding corroborating evidence to back up the visualizations, I have come to a final conclusion. There is clearly an injustice within society in terms of how legal enforcement treats people of different races. Thus, it is important to reform the legal enforcement system in order to improve interactions between these street level bureaucrats and those of different races.